


If you’re diving into Power BI, one term you’ll frequently encounter is DAX. But what is DAX in Power BI and why is it important? Whether you’re a beginner or a data pro, understanding DAX functions, formulas, and queries is critical to mastering the true power of Power BI. In this blog, we’ll explain DAX in Power BI in simple words, how it’s used in desktop, pivot, and Excel integrations, and provide practical examples to get you started.
What is DAX in Power BI?
DAX (Data Analysis Expressions) is a formula language used in Power BI, Power Pivot, and Analysis Services. Think of it as Excel formulas on steroids. It allows you to create custom measures, calculated columns, and tables to gain deeper insights from your data.
In Power BI Desktop, DAX is the engine behind all calculations. If you want to perform advanced data analysis beyond simple drag-and-drop visuals, DAX is your go-to tool.


What is DAX in Power BI in Simple Words?
In simple terms, DAX helps you calculate values dynamically from your data. For instance, if you want to calculate total sales, average profit, or running totals — DAX makes it possible. It’s like writing smart formulas that talk to your data model.
What is DAX in Power BI and Why is it Used?
DAX is used to:
- Perform calculations not available by default
- Add intelligence to your visuals (e.g., year-over-year comparison)
- Filter and slice data dynamically
- Create KPIs, custom metrics, and business logic
Without DAX, Power BI is just a data visualization tool. With DAX, it becomes an intelligent business analytics platform.
What is DAX in Power BI and Why is it Important?
DAX is important because:
- It allows custom business logic
- Supports advanced data modeling
- Helps build complex dashboards
- Enables dynamic interaction between charts and filters
For example, a report showing “Sales This Month vs Last Month” requires a DAX measure using SAMEPERIODLASTYEAR() or PREVIOUSMONTH() functions.
What is DAX Measure in Power BI?
A DAX measure is a dynamic calculation that updates based on filters and visuals. For example:
DAXCopyEditTotal Sales = SUM(Sales[Amount])
This simple DAX measure will dynamically calculate the total sales based on your filters, slicers, or time frames.
What is DAX Query in Power BI?
A DAX query is used to extract data directly using a structured query. It’s different from using visual tools or dragging fields. For example:
DAXCopyEditEVALUATE SUMMARIZE(
    Sales,
    Sales[Product],
    "Total Sales", SUM(Sales[Amount])
)
This DAX query returns a table showing total sales by product.
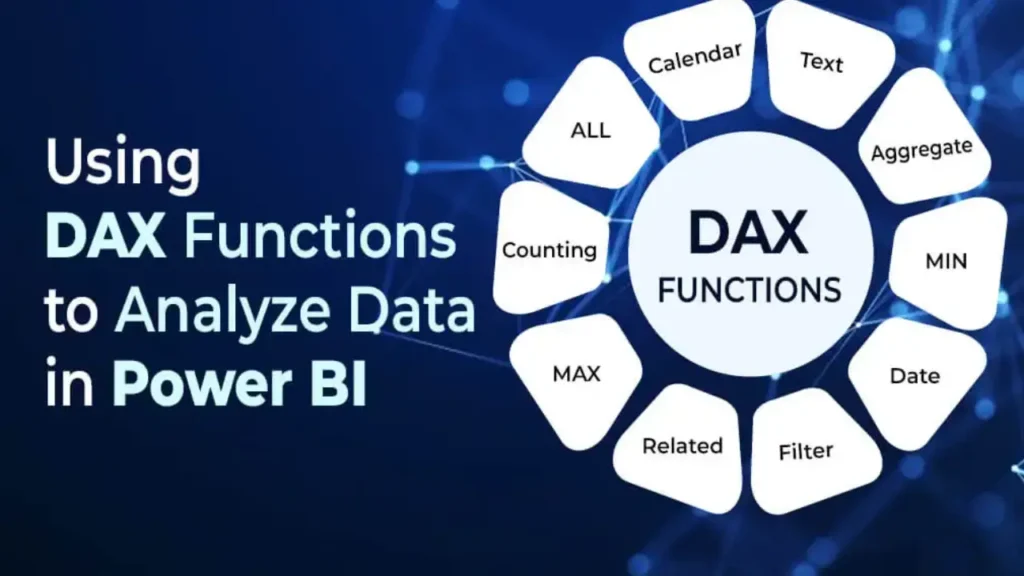
DAX Formulas and Functions in Power BI
DAX includes hundreds of functions, similar to Excel, but optimized for relational data.
| Category | Example Functions |
|---|---|
| Aggregation | SUM(), AVERAGE(), COUNT() |
| Time Intelligence | DATEADD(), TOTALYTD(), SAMEPERIODLASTYEAR() |
| Logical | IF(), SWITCH(), AND(), OR() |
| Filter | CALCULATE(), FILTER(), ALL() |
What is DAX in Power BI Desktop?
In Power BI Desktop, you write DAX inside:
- Report view: for measures and visuals
- Data view: for calculated columns
- Model view: to define relationships and hierarchies
DAX is deeply integrated into every part of Power BI Desktop.
What is DAX in Power Pivot?
Power Pivot in Excel uses the same DAX language. So, if you’re transitioning from Excel to Power BI or using both together, your DAX knowledge is transferable.
What is DAX Studio in Power BI?
DAX Studio is a free external tool used to write, test, and optimize DAX queries. It connects to your Power BI model and helps improve performance by analyzing query execution.
What is DAX in Power BI W3Schools?
While W3Schools is a great place to learn many coding languages, it doesn’t cover DAX as deeply as Microsoft’s documentation or community forums. For learning DAX, consider:
- Microsoft Learn
- SQLBI.com
- RADACAD
- DAX Guide (by SQLBI)
Conclusion
Understanding what DAX is in Power BI opens up a new world of analytics and business intelligence. From creating simple measures to building complex models and reports, DAX is the core language that empowers your dashboards to be smarter and more actionable.
If you’re just starting, focus on learning DAX functions, formulas, and queries step-by-step. Tools like DAX Studio and communities like Power BI forums can be your best friends on this journey.